Using Google Analytics to Create a Data Incentivized Customer Journey
As we attempt to navigate the complexity of Google Analytics to better understand our website, there are a few data points we should look at before creating our marketing strategy. The rich data we discover will enable us to create a custom user journey path and help personalize our website, ads, and content to improve all aspects of our 2020 digital marketing plan.
Target Markets
If you haven’t identified your geographical target markets, or you’re looking to fine tune your current strategy, consider using the Audience > Geo-Location report to identify who is coming to your site compared to who brings in the most revenue. You may think Arizona is your best market with the largest amount of traffic and transactions, but take a closer look and you’ll find that California brings in more revenue! With this data, you can decide if you want to introduce new CA users to your funnel, or work on improving your conversion rates for AZ.
*Tip – If you’re looking to implement a plan for Q1, ensure you’re analyzing January-March of the previous year to see who is likely to book again this year.
Website Engagement
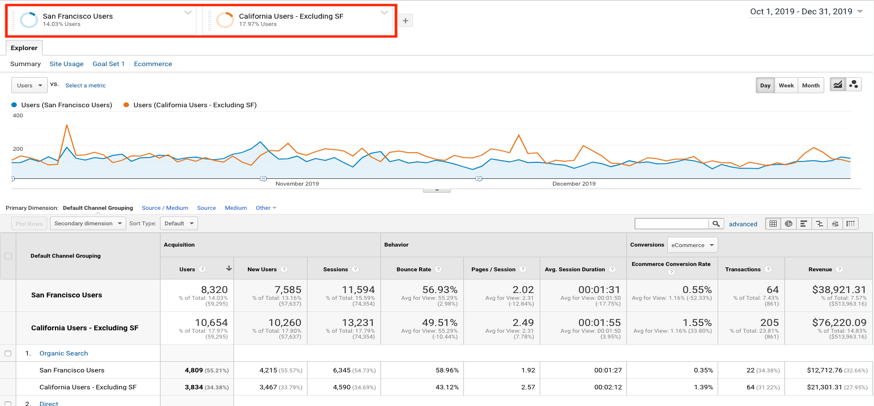
Once you discover California as the bulk of your revenue, you may want to break that down further to see how these users interact on your website. Segments, which are about the most simplistic yet complex aspect of Google Analytics, will allow you to view multiple custom audiences on ALL pages of Google Analytics, at the same time. As you look at your favorite views in GA, change from the default “All Users” to view to only show a specific audience, user location, device, common user page paths, etc. For example, by using the geolocation view, you can create segments for users in San Francisco compared to all other Californians and compare acquisition, revenue, bounce rate, etc.
*Tip – try using segments in your E-Commerce product reports to see if different users book different packages and room types!
Personalized Ads
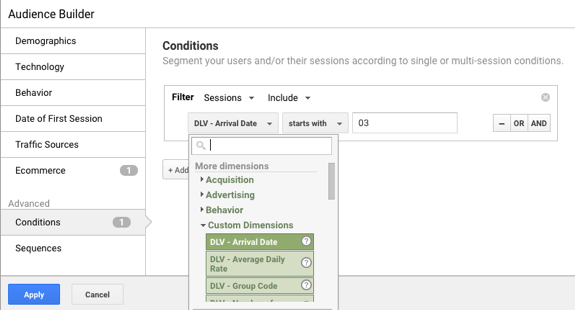
Once you’ve identified the locations you want to prioritize, sending the same ad won’t benefit them if they are looking at different seasons for their travel. When you create new audiences, you can publish them to your Google Ads account for remarketing. Consider adding custom dimensions with booking engine data to identify which month the user is looking to book. With that data, you can create ads for users searching for stay dates in March, and send them personalized offers such as spring break escapes.
*Tip – Once you have custom dimension data, use it to analyze the booking windows and seasonality for different geo locations. For example, publish content for spring break activities and send them to local Texans during their 14 day booking window.
Packages & Promotions
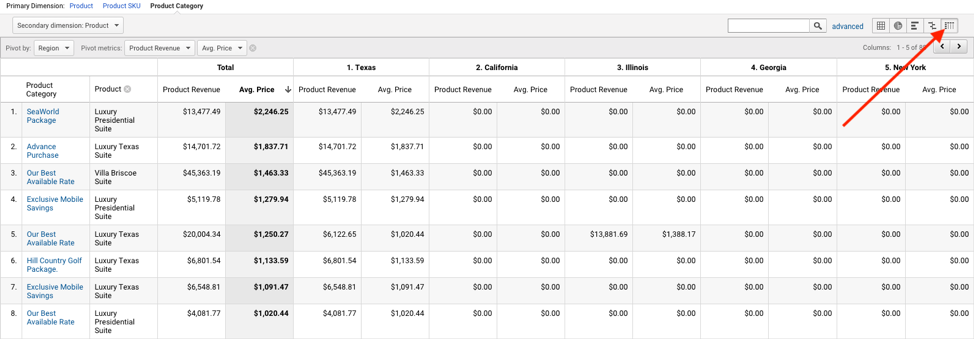
Whether your goal is revenue, bookings, or a higher share of direct bookings, understanding what guests are booking will play a huge part in your website and ad content. For the data lovers out there, Pivot Tables are an extremely valuable function when looking to add a 3rd dimension to your data set. You can utilize this table in your e-commerce report to identify which room types and packages are contributing to the most bookings and room nights.
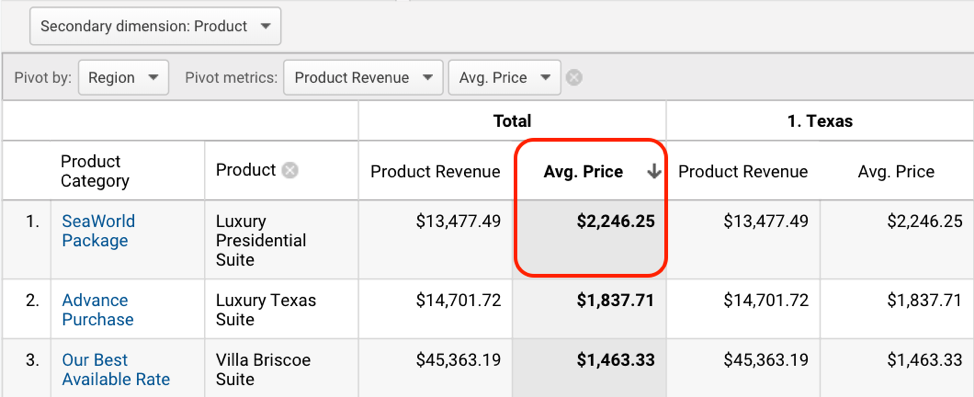
Taking a closer look, I’d try to sell more SeaWorld Packages in that Luxury Presidential Suite…
*Tip – try adding a Google Analytics segment to your pivot table to get a FOURTH dimension!
Landing Page
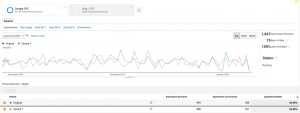
With the right targeting settings, personalized content and appropriate offer selection, you’re well on your way to a successful ad campaign. As an advertiser, you won’t want to stop there to assume the transaction is also on it’s way. A compelling landing page with appropriate content is key to driving the user to complete the action you’re hoping for. Through experimental solutions such as Google Optimize, you can A/B test different variants of your page such as call to actions, page paths, content and more. The Behavior > Experiments portion of Google Analytics will enable you to analyze your variants and decide which page exceeded your KPIs!
*Tip – Create an experiment for users coming from a specific location or ads campaign with a unique and personalized landing page experience.
Once you grasp the image of your ideal consumer and comprehend how and why they convert, you’ll reveal your secret weapon to grow your revenue in 2020! Your user journey approach will be personalized to as many audiences as you choose, and you’ll be that much closer to increasing your annual KPIs. For help on analyzing and creating a data incentivized customer journey, contact Screen Pilot to get started on your enhanced marketing plan.
By Meredith Rauch
Paid Search Strategy Manager, Screen Pilot


