2016 and Beyond – Official Forecast
(Video Above: Opening remarks on the economy by Bob Rauch at RAR Hospitality’s annual forecast event.)
Executive Summary
2016 is looking to continue the trend line of 2015 albeit with a somewhat muted feel. While average daily rate growth (ADR) will be a solid 4.5 percent, occupancy levels look to remain relatively flat, up just one half of one percent with demand outpacing supply 2.2 percent to 1.7 percent according to Lodging Econometrics and STR respectively, so this translates to a 5 percent growth in revenue per available room (RevPAR). Coupled with capital availability and the analytics and trends discussed below, this will be an active and exciting year.
Because all the headwinds we expect in 2017 will not have fully materialized, we will still have the most profitable year ever in our industry. We’re not foreseeing a recession as we’ve experienced in past economic downturns, but more of a soft landing in 2017 as the economy pulls back slightly. There are a multitude of factors that will impact our industry and lead to this soft landing in our opinion. While there has been a dramatic collapse in oil and other commodity prices, the U.S. economy has returned to fairly full employment (i.e., the unemployment rate is currently at 4.9 percent and still in a downward trend), inflation risks remain low and the Fed is not sure if they are lowering or raising interest rates and 2016 is an election year—this will be another great year.
San Diego County
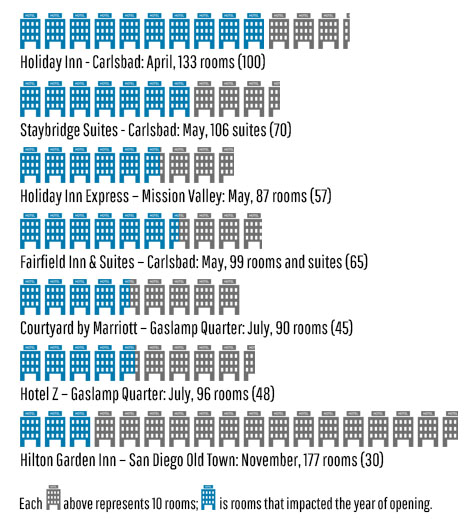
In 2015, occupancy in San Diego County increased 2.4 percent to 76.4 percent and average rate grew 6.0 percent to $150.64. Revenue per available room (RevPAR) moved up 8.6 percent to $115.04. New hotels that were added in 2015 included 805 rooms but based on their opening dates, the 2015 impact is less as indicated below in parentheses.
2015 Total: 805 rooms open with an impact of 427 rooms or less than 1 percent new supply based on each hotel’s opening date. As a result, the balance of the impact from these hotels will be in 2016.
In 2016, we expect occupancy levels to remain at 76 percent with average rate growth of 5 percent to $158 and RevPAR of $120. New supply will increase by 2 percent and will be absorbed by demand increases at the same level. Rates will grow based on the number of sellout nights in the market, the negotiated rates during the request for proposal season, the rates on the books according to TravelClick and other sources and election year economics.
2016 Total: 1,375 rooms open with an impact of 843 rooms based on each hotel’s opening. Including the balance of the 378 rooms from the hotels that opened in mid-2015 and onwards, the total rooms added to the supply are 1,221 or approximately 2 percent of the 60,000 hotel rooms in the County.
While there are a number of hotels opening in 2017, this supply increase is rather muted compared to New York and many other U.S. cities.
In 2016, San Diego County will be adding the following hotels:
Downtown San Diego eclipsed the 80 percent occupancy mark in 2015 hitting 80.4 percent, up one percentage point from 2014 at an average rate of $189.17, up 7.8 percent from 2014. This RevPAR growth of 8.8 percent brought 2015’s RevPAR to $152.18.
Downtown is driven largely by group business, convention center demand, some corporate, and fairly strong leisure due to the always improving downtown lifestyle and environment. The convention center alone is expected to contribute at least 856,000 room nights in the Downtown market (and to other submarkets through compression) from over 100 events and at least 900,000 attendees. Little Italy, the Gaslamp Quarter and the waterfront provide very strong demand year around.
Downtown hotels opened in 2015:
- Courtyard by Marriott – Gaslamp Quarter: July, 90 rooms (45)
- Hotel Z: July, 96 rooms (48)
2016 will bring additional hotels as well as strong convention center demand due to strong cyclical bookings by the San Diego Tourism Authority. New supply will be up 6.5 percent but demand will increase by nearly 6 percent, holding occupancy levels at 80 percent. Average rates will continue to grow due to the number of sellout nights and some compression from a few notable citywide conventions from $189.17 to $198.62, up 5 percent. RevPAR will increase 4.5 percent to $157.
Downtown hotels opening in 2016:
- Springhill Suites – San Diego Bayfront: February, 253 (226)
- Residence Inn – San Diego Bayfront: February, 147 (133)
- Hilton Garden Inn – San Diego Bayside: June, 204 (119)
- Homewood Suites – San Diego Bayside: June, 160 (93)
- Pendry Hotel – San Diego, November, 317 (50)
2016 Total: 1,081 total rooms but rooms that will impact 2016 are 621 or just over 6 percent of supply.
Note: We anticipate that Airbnb will have a significant impact on average rates during peak periods, however, the overall annualized impact will be minimal in 2016.
This submarket finished 2015 with occupancy rates of 78.6 percent, up 1.4 percent from 2014. Average rates grew to $127.29, up 5.2 percent and RevPAR was $100.05, up 6.7 percent. Hotels here are generally close to the airport and of all product types from full-service to limited-service, waterfront to near downtown transient accommodations. Occupancy levels will stay flat as supply and demand are in balance and rates should grow at 4 percent to hit $132.
Point Loma rooms added in 2016:
- Kona Kai Resort: July, 41 (20)
The Mission Valley submarket saw occupancy levels of 77.6 percent in 2015, up 4.8 percent from 2014. Average rates were $115.01, up 6.5 percent from 2014 and RevPAR was $89.25, up double digits by 11.5 percent! The Mission Valley submarket has seen a fundamental shift away from the older Hotel Circle hotels of the 1970s and 1980s to branded, strong limited-service products and renovated full-service hotels. Demand is driven largely by groups and leisure but has been increasingly gathering corporate business.
Mission Valley hotels opened in 2015:
- Holiday Inn Express – Mission Valley: May, 104 rooms (69)
- Hilton Garden Inn – San Diego Old Town: November, 177 rooms (30)
2016 will see additional supply in Mission Valley but occupancy will remain flat as demand matches the increased supply of 3 percent. ADR and RevPAR will increase 5 percent to $120.76 and $93.71, respectively.
Mission Valley hotels opening in 2016:
- Springhill Suites – Mission Valley: March, 135 suites (112)
- Homewood Suites – Mission Valley: April, 118 suites (90)
Mission Bay hit occupancy levels of 79.1 percent, up 1.4 percent over 2014. Average rates were $179.09, up 5.3 percent and RevPAR was $141.75, up 6.8 percent year over year. Mission Bay is a group market with mostly older, waterfront hotels that have been substantially renovated. In most cases, these are independent hotels that benefit from a strong amenity package and waterfront locations.
Mission Bay has not added new hotels and will continue to perform well, increasing occupancy levels to 80 percent and average rates to $185, up 1 and 4 percent respectively. RevPAR will climb to $148.
The La Jolla market had occupancy levels of 76.9 percent, an increase of 1.3 percent over 2014. Average rates grew 7.8 percent to $225.69 with RevPAR up 9.1 percent to $173.46. This submarket has very strong leisure business, some group business and light corporate business. It includes all of the hotel product in or around the Village of La Jolla. La Jolla is a favorite of higher end leisure travelers. With no new supply, this pattern of growth will continue albeit in a somewhat muted way with occupancy up one percentage point to 77.5 percent and average rates up four percent to $234. RevPAR will climb five percent to $182.
This group of hotels finished 2015 at 80.8 percent, up 3 percent from 2014 and had an average rate of $170.51, up 5 percent year over year. RevPAR was up 8.2 percent to $137.74. In 2016, this group will have stable occupancy levels and will grow average rate by 5 percent to $179 and RevPAR to $145.
This submarket includes Sorrento Valley, Carmel Valley and UTC. Half the hotels are full-service and the other half are limited-service and they range from the Fairmont Grand Del Mar on the high end to economy properties in Sorrento Mesa. The market has strong group, leisure and corporate demand from multiple industrial parks, biotechnology, life science and medical equipment companies as well as the communication technology sector.
This sub-market hit occupancies of 72.8 percent, up 2.1 percent from 2014. Average rates were $126.92, up 5.3 percent year over year. RevPAR was $92.44, up 7.4 percent from 2014. In 2016, this market will see continued rate growth of 5 percent landing at $133 while occupancies will climb one point to 74 percent.
This area includes Kearny Mesa, Rancho Bernardo and Miramar and has recently become better equipped to handle leisure business with the combination of the San Diego Zoo Safari Park, golf courses, wineries, breweries and other attractions. Corporate business is solid with numerous industrial parks.
In 2015, San Diego County Northeast (Escondido, San Marcos, and Vista) saw occupancy levels increase to 71.5 percent, up 2.4 percent with rates up to $114, an increase of 5.5 percent, and RevPAR up 8 percent to $80.91. Demand was up 4 percent and supply up 1.6 percent.
Escondido has finally created a cross-section of demand generators in the corporate and leisure markets, San Marcos has benefitted from very strong growth in the health care and education sector, and Vista is located proximate to both Carlsbad and San Marcos with its own industrial park demand.
In 2016, this area will see occupancy levels increase one point to 72 percent, average rates grow 5 percent to $120, and RevPAR up 6 percent to $86. The SR-78 corridor, coupled with the growth of California State University San Marcos, health care facilities and population growth make this an area that is both desirable and will see more new supply over the next two years.
In 2015, San Diego County Northwest (Carlsbad/Oceanside) saw an increase in occupancy to 71.1 percent, up 0.9 percent from 2014 with average rates up 5.5 percent to $147. The room count increased by 235 rooms, up 3.6 percent, with demand increasing 4.6 percent. RevPAR saw growth of 6.5 percent, moving up to $108.
In 2016, this coastal area will see occupancy levels remaining flat at 71 percent with average rates growing by five percent to $154 and RevPAR up to $113.
This area has seen massive increases in supply over the past few years and has absorbed this supply with very strong occupancy levels and rate growth. Carlsbad’s deep industrial parks coupled with its proximity to leisure demand generators such as beaches, Legoland, San Diego Zoo Safari Park and the Village of Carlsbad have provided steady demand growth.
Oceanside has seen a slow but steady growth of leisure travel, military demand and some corporate growth to accommodate the new supply that has entered the market. In both Carlsbad and Oceanside we see continued strong growth with occupancy levels remaining flat for the Northwest area at 71 percent as it absorbed the new hotels opened in 2015 and average rates growing 5 percent to $159.
Northwest hotels opened in 2015:
- Holiday Inn – Carlsbad: April, 133 rooms (100)
- StayBridge Suites – Carlsbad: May, 106 suites (70)
- Fairfield Inn & Suites – Carlsbad: May, 99 rooms and suites (65)
U.S. Economy and Impact on Hospitality 2016 and 2017
With 2016 being an election year in the U.S., the impacts of new economic policies will only start to be noticeable in 2017. Further, the Institute of Supply Management shows continued growth of the economy and projects a 1.8 percent growth in Gross Domestic Product. This is consistent with The Economic Outlook Group forecast of a continued 2 percent or more growth in GDP.
After a period of growth and prosperity, the ever present threat of new supply will rear its head, though it will be less impactful than it could have been as banks continue to maintain rigid standards for lending. With forecasted occupancies remaining flat in most markets this year, as new supply enters the market we will see a supply/demand imbalance beginning in 2017 in many markets even if demand keeps pace with 2016 levels.
UBS is forecasting a reduction of capacity utilization for 2016. They are estimating 76.9 percent, down from 78.3 percent previously; UBS reports that every 1 percentage point of capacity utilization is about 20 basis points of RevPAR growth. Expectations of a higher unemployment rate, now at 4.9 percent and up from 4.6 percent previously, will also have a negative impact on the lodging industry, according to UBS.
As these factors start to weigh on the industry we will notice an even bigger impact from OTAs and the sharing economy. The American Hotel & Lodging Association warned earlier in 2015 that the now completed merger of Expedia and Orbitz would create a duopoly controlling 95 percent of the market. The sharing economy (mainly Airbnb), discussed thoroughly in our March newsletter, has yet to really impact the hospitality industry as most of the impact has been during extremely high demand periods. As the economic pullback sets in and the OTAs reclaim lost market share, we will start to see a noticeable impact from the likes of Airbnb as guests get more comfortable with the platform and use it to seek out quality and affordable options.
Fallout from minimum wage increases and changes to overtime laws for salaried workers will begin to be noticeable in 2017. EBITDA (formerly referred to in our industry as Net Operating Income or NOI) will be impacted as minimum wage increases take effect over the next few years. Health care cost increases are another contributing factor to our soft landing in 2017. Further, the industry has been growing RevPAR on the plus side for 67 months so it should not be a surprise if that trend is in jeopardy at the end of this year as we will have grown RevPAR for nearly 80 months.
Trends in 2016
Analytics is taking a front seat with executives clamoring for data as everything is trackable now. We are able to see how much attention a certain ad campaign is getting as well as the geographic location of the users interacting with it, their age and a general idea on their income. Mobile data science companies take things a step further. They can provide incredibly specific attributes about buyers by their mobile identification numbers (MIN). These attributes include car type, job type, office size, net worth and political affiliation. The amount of information available to us today is almost scary. But therein also is the problem, there is so much data that we need to be able to sift through it and discern what is actually useful to grow our business. Data collection is one thing but data analysis is the key.
Digital marketing continues to be dominated by two words: mobile and video. The average user consumes more than 65 minutes of live mobile video a day and this number is growing fast. Millennials look at streaming video the same way past generations viewed television. With Facebook Live finally emerging into the market, the future of knowledge and culture remains in digital, though that should never have been in question. Further, guests are using social media outlets, community apps, and online forums not only to research and book hotels, but to gauge the hotel’s brand identity. Increasingly this is being done on mobile devices.
The Marriott acquisition of Starwood as well as the 11th hour disruptive bid from Anbang and the Expedia acquisition of Orbitz are harbingers of a consolidation coming in the hotel industry. While it is too soon to determine what other brands or companies will decide to come together, it is clear that we are entering the age of consolidation as the economy enters the mature stage.
Soft Branding has hit full stride this year with the recent addition of several major “soft brands” like Hilton’s Curio and Canopy, Marriott’s Autograph and Moxy, Choice’s Ascend, Best Western Premiere, Hyatt’s new Unbound Collection and many more including original soft brands Leading Hotels of the World and Preferred. While some of the aforementioned are priced pretty high relative to hard brands, they are very often more flexible in terms of design and standards of operation as well as contract term.
Adhering to the science of hospitality, revenue management is a constant work in progress that is now 40 years old but evolving at warp speed. Take a hard look at who is the most profitable customer and what room types are in highest demand each and every day and make certain your team is accurately forecasting demand. Revenue management has always created pricing strategies based on the forecasting of demand. While still in widespread use and often considered state of the art, forecast-based pricing can miss opportunities to maximize long-term customer value as it focuses on short-term revenue gains. By failing to differentiate which customers are coming at which price, this pricing strategy/tactic may reduce the optimization of your loyalty program or worse. Monitoring your online review scores more closely and factoring them into your decision-making, coupled with monitoring your regrets and denials will also allow you to price more effectively.
According to the 2015 MMGY Global Portrait of American Travelers®, “47 percent of millennial travelers reported that their travel destinations represent “who they are,” compared with only 34 percent of Gen Xers and 34 percent of baby boomers. Customers are increasingly demanding that travel enrich their lives, and be driven by exposure to unique experiences and integration with local atmospheres, as opposed to travel driven by a singular product (e.g., individual hotel or attraction) within a destination.”
Corporate Strategy
No matter how hard some people may fight it, Airbnb, Uber, and the likes are here to stay. Hotels should innovate and provide quality alternatives with the same appeal to the maximum extent possible. Mobile/digital check-in, easily accessible and plentiful outlets in all areas, and reliable and fast wi-fi are some of the amenities desired by those who utilize Airbnb and HomeAway. The hotel industry should not take its cues from the music and taxi industries that could not embrace change and continue to implode. More disruption is on the way!
Taking an agile approach to the market involves the creation of a viable value proposition and an ability to optimize your relationships and assets to enter the “new normal” of a soft landing. This allows you to build a sustainable model and develop communication channels, many of which are new to this decade.
According to Ernst & Young (EY), “over the past decade, the value proposition within hospitality has evolved from a pure product play (e.g., hotel room, management service) to an experiential proposition, offering a customized level of service and information demanded by stakeholders. Whether your objective is to achieve growth through scale, capture market share or fulfill unmet customer demand, dynamically developing and refining your business plan — with key stakeholders in mind — remains crucial to achieving success.”
Capital Flow
According to Real Capital analytics, “cross-border capital flow from Asia into global lodging markets is anticipated to continue to increase. In 2015, overseas capital accounted for 35 percent of global hotel investments, with Asian investors representing approximately 33 percent of these transactions. Asia’s sovereign wealth funds and insurance companies, particularly those from China, have invested heavily in high-profile assets in gateway cities. China remained the most active Asian hotel buyer in 2015, accounting for 44.7 percent of total invested capital from Asia, followed by Singapore at 16.7 percent and South Korea at 15.6.” As Daniel Lesser, President and CEO of LW Hospitality Advisors indicated recently, “the U.S. is the safest place on the planet to park money.”
Destination Marketing Organizations
In 2015, destination marketing organizations (DMOs), entities that promote places for tourism, employed a number of strategies to deliver consistent experiences across tourism products, using the power of social media analysis and leveraging the resources of the sharing economy. Given the success many DMOs have had with these strategies, public and private tourism stakeholders including economic development agencies, governing bodies and hotel owners and operators are taking notice and increasingly empowering DMOs to enhance a destination’s value proposition.
Globally, shared lodging and transportation have in many ways disrupted traditional operating models. As a result, many DMOs are partnering with technology providers to improve the access, experience and affordability of their products and services. Examples include Mexico City, San Francisco and Philadelphia, which have actively promoted usage of sharing economy companies to increase transportation capacity in areas with limited public transit and to increase lodging supply during peak visitation periods. Further, DMOs who receive an increased stream of promotional dollars via a Tourism Marketing District (TMD) have an opportunity to significantly shift market share. San Diego is the best large city example as their TMD was wiped out by a crazy mayor in 2013 and reinstated one year later. The results showed a remarkable return of demand.
Technology
Technology continues to play an ever-increasing role in the hospitality sector. It is making a difference from the front of the house to the back of the house. In fact, hospitality and leisure sector leaders cited technology as one of their businesses’ top organic growth strategies in EY’s November 2015 Global Capital Confidence Barometer survey, and for a good reason: opportunities for growth may exist across many aspects of the product life cycle. In the year ahead, hospitality players should expect further technological advancements to loyalty programs and revenue management strategies (RMS) and greater adoption of the Internet of Things (IoT).
The opportunities afforded by IoT is on the horizon as hospitality companies adopt this network of everyday physical objects or “things” that contain electronics, sensors and network connectivity that allows them to collect and exchange data. These objects can communicate with each other, increase operational efficiency and enhance the guest experience at the same time. This will allow a number of time-consuming processes to be automated. For example, new smart refrigerators will reorder depleted stock, adjust the temperature as required and notify staff if any parts are not functioning properly. Similarly, a guest’s hotel room preferences regarding lighting, temperature and favorite snacks will be recorded to provide a more personalized experience.
We are so bullish on technology being a change agent for hospitality that we constantly look at technology partners to assist us in developing an app that will meet our current and future customer demand. We believe that owning the customer is paramount to our ability to control distribution costs and clearly, independent operators are vulnerable to OTA costs and must fend for themselves. Further, we must use technology to increase our ability to provide a safe and secure environment for our guests and team members. The Erin Andrews verdict tells us we must be extraordinarily vigilant and have protocols and security innovations in place that prepare us against cybercrime and terrorism as well as protection against bad boys.
2015 Final Industry Statistics – U.S. and Selected Markets Forecast and Values
Occupancy levels finished 2015 at 65.6 percent, up from 64.4 percent in 2014, an increase of 1.7 percent. Average rates finished at $120.01, up from $114.92, an increase of 4.4 percent and RevPAR finished at $78.67, up from $74.04, an increase of 6.3 percent.
We believe 2016 will provide growth of 0.5 percent in occupancy to just under 66 percent with average rates climbing to $125.50, up 4.5 percent and RevPAR growing to $77.75, an increase of 5 percent. According to STR, one of the healthiest segments is luxury. The pipeline of new construction in that segment is under 5 percent of the over 140,000 rooms under construction.
Hotel values may have peaked nationally as REITs are not actively purchasing since their stocks declined and the runway provided by 2013-2015 is shorter. However, values may not decline this year. Private equity is in abundance, 2016 still has a positive, election year outlook and foreign capital continues to find the U.S. lodging industry to be attractive.
In San Diego, where we operate 9 hotels, we saw occupancy finish at 76.4 percent, up from 74.6 percent in 2014, an increase of 2.4 percent. Average rates grew to $150.73, up 6.1 percent from $142.12 and RevPAR grew from $105.98 to $115.11, up 8.6 percent from 2014 to 2015. Values will continue to increase due to limited new supply, barriers to entry, strong group and leisure demand and the potential for a convention center expansion downtown.
In Phoenix, where we operate 5 hotels, we saw occupancy finish at 65.9 percent, up 4.4 percent from 63.1 percent, average rates up to $121.09, up 8 percent from $112.14 and RevPAR at $79.77, up 12.8 percent from $70.74. Yes, the Super Bowl blew up Q1 2015 numbers so the comps to date in 2016 will not provide a fair comparison, but Phoenix will finish with occupancy up to 67 percent, average rate up to $125 and RevPAR up to $84, up 5 percent from 2015 even considering the difficult comps from the Super Bowl year.
Though we are coming to the end of our current economic cycle, it does not mean we are entering a recession. We are currently still forecasting 1-2 percent growth for 2017, but as hoteliers we need to prepare ahead of time for this pullback after several years of fantastic growth. Invest in upgrading your product while profits are strong and interest rates are low so you can keep up with the new supply as we enter this soft landing. With the current geopolitical threats around the world, any unforeseen event could tilt this soft landing toward a more difficult economic environment. Stay ahead of the curve the best you can and arm yourself with the tools and talent you need to succeed in a softer economy. That is a good plan regardless of what happens. Good luck in 2016, it will be a great year so enjoy it!
Robert A. Rauch, CHA
